Click here for an easy-to-use standalone RBioplot web application!
RBioplot - An R package for statistics and graphing for molecular biology and biochemistry. When using this program remember to cite: Zhang J and Storey KB. (2016) RBioplot: an easy-to-use R pipeline for automated statistical analysis and data visualization in molecular biology and biochemistry. PeerJ 4:e2436. PMID:27703842.
For a detailed installation guide and step-by-step user manual, download the following RBioplot Technical Bulletin. pdf. This technical note demonstrates how to use all the RBioplot graphing functions, provides relevant examples (input files and output files), and outlines the various commands and how to customize them.

Download and install R and R Studio. To install the latest version of RBioplot, please select the following commands (copy/paste) and run them in R Studio (make sure you are connected to the internet):
(1) Run the following command to install devtools, otherwise skip this step:
install.packages("devtools")(2) Run the following command:
devtools::install_github("jzhangc/git_R_STATS_KBS/package/rbioplot")(3) To set a working directory use, replace
"..." with your folder address: For Windows
setwd("C:Desktopetc") For Mac and Linux
setwd("~/Desktop/etc")Statistical analysis
The files below are examples of input and output files from the rbiostats statistical analysis function (western blot protein expression):
DEMO- Input data format: Sample Proteins .csv [outliers removed]
DEMO- Statistics output: Sample Proteins.stas .txt [ANOVA]
Histogram
The files below are examples of input and output files from the rbioplot histogram function (western blot protein expression):
DEMO- Input data format: Sample Proteins .csv [outliers removed]
DEMO- Plot output: Sample Proteins.plot .csv and Sample Proteins.plot .pdf [Tukey]
Heatmap
The files below are examples of typical input and output files for the rbioplot_heatmap function (microRNA differential expression analysis):
DEMO- Input data format: Sample microRNAs. csv
DEMO- Plot output: Sample microRNAs.plot.heatmap. csv and Sample microRNAs.plot.heatmap .pdf [Dunnett]
Joint-Point Curve
The files below are examples of typical input and output files for the rbioplot_curve function:
DEMO- Input data format: Sample Elution Profile. csv
DEMO- Plot output: Sample Elution Profile.plot .csv and Sample Elution Profile.plot .pdf
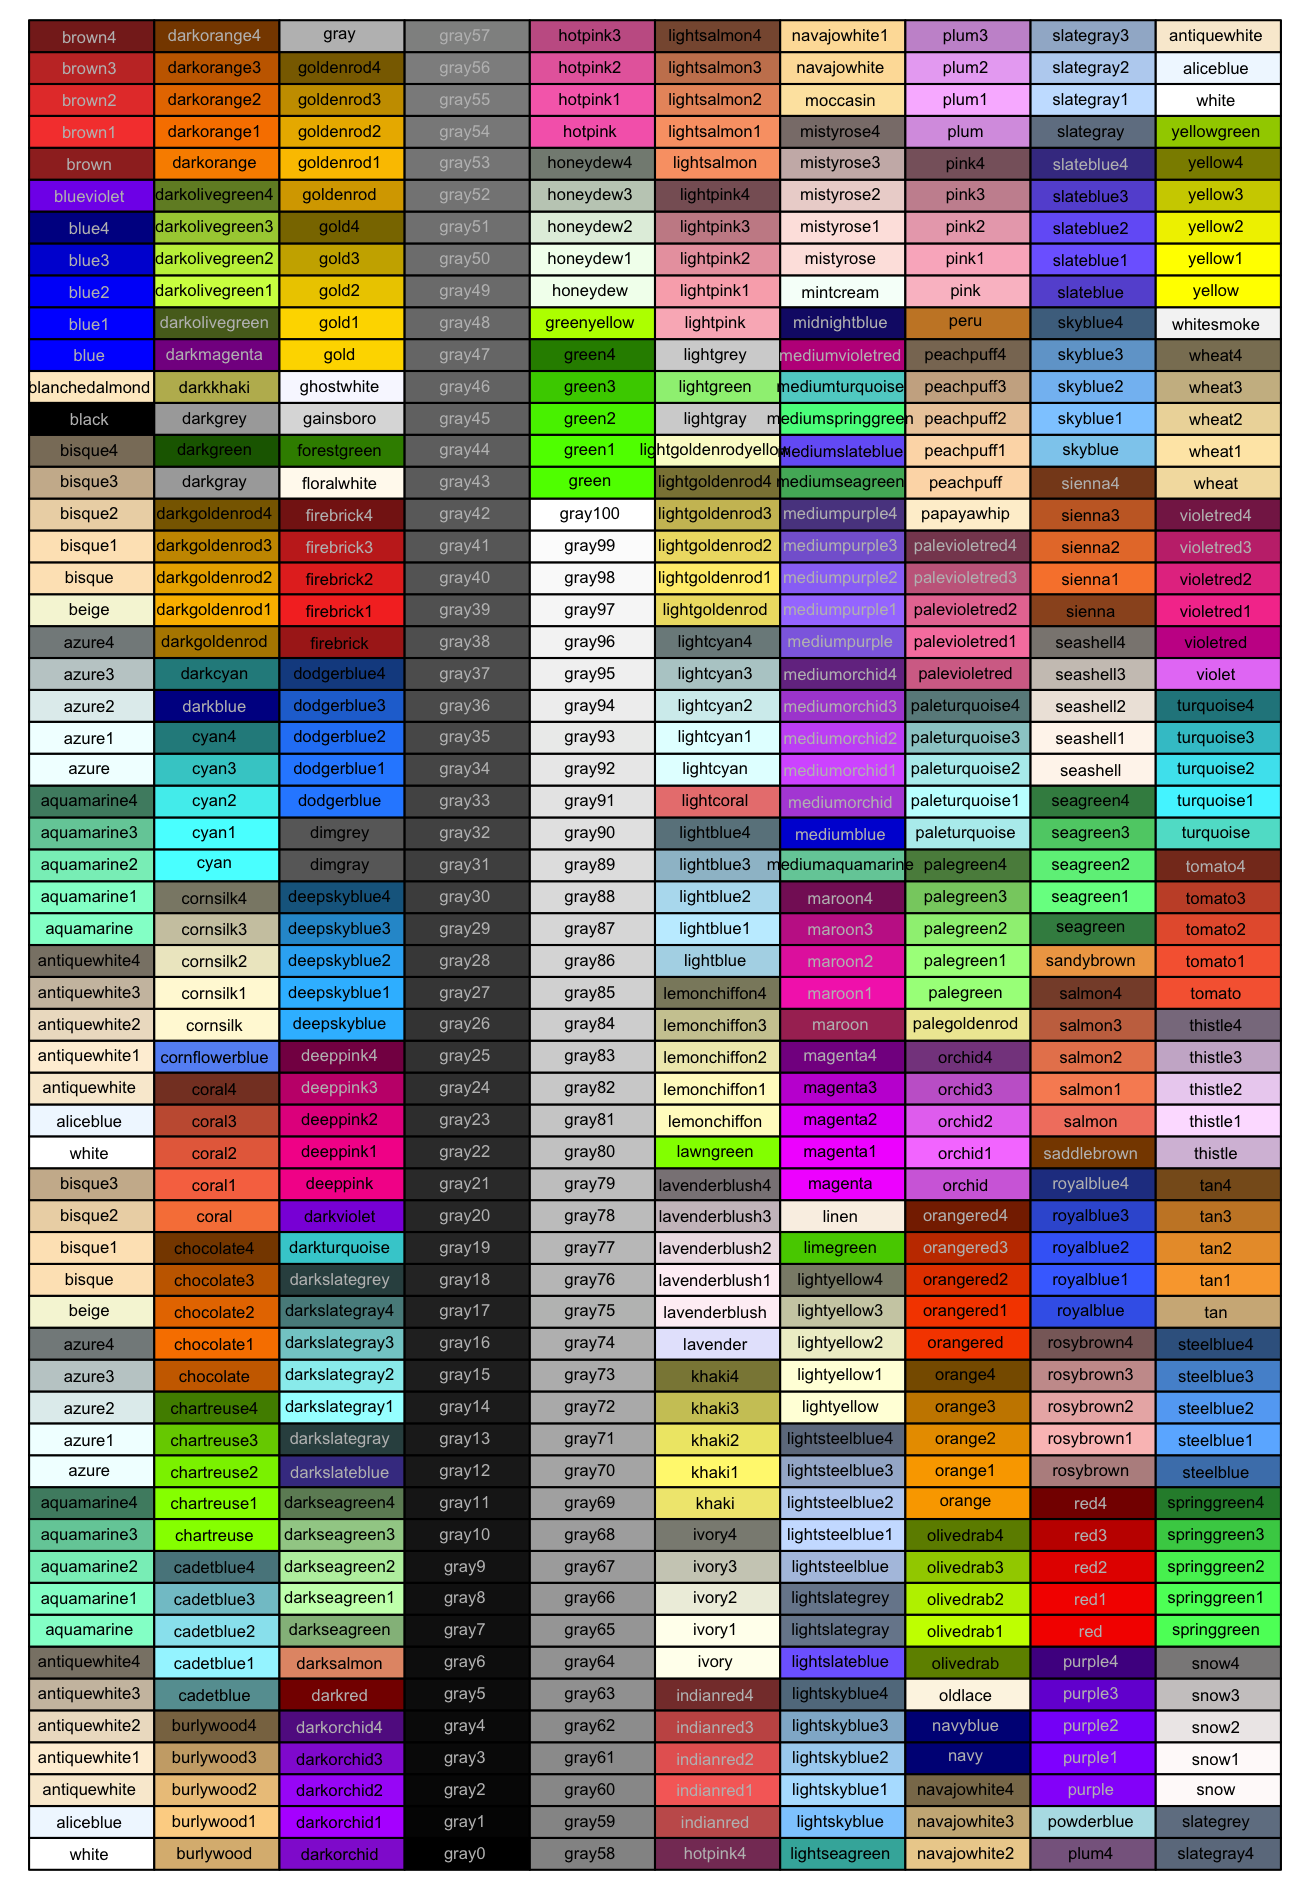
R colour palette
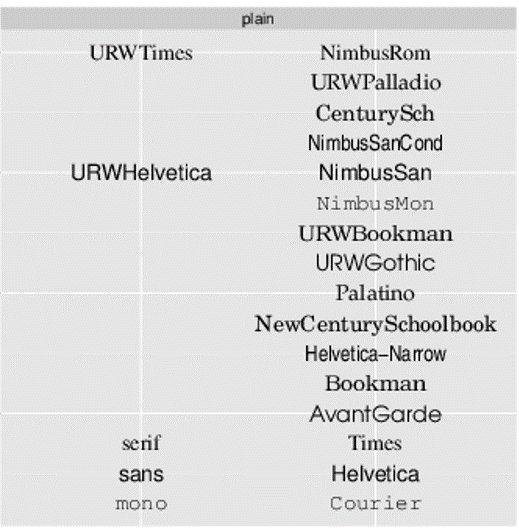
R font table
Version requirement for dependencies: multcomp (>= 1.4-4),multcompView (>= 0.1-7), ggplot2 (>=2.1.0), reshape2 (>= 1.4.1), gtable (>= 0.2.0), grid (>= 3.2.4).
Built: R 3.2.5